
Sales onboarding metrics are the measurable signals that show whether a new rep is on track to ramp, drawn from their practice and early calls rather than from revenue that arrives months later. The ones that predict readiness are behavioral: talk-to-listen ratio, questions asked per call, objection-handling rate, speaking pace, and a role-play score against your playbook.
Most onboarding scorecards measure attendance and course completion. Those tell you a rep showed up, not that they can hold a discovery call. This guide front-loads the benchmarks that actually move ramp, with tables you can lift into your own scorecard, then shows how to turn them into a clear "ready for live calls" decision. The proof behind the approach is concrete: in the Mentor Group case study, pairing AI role-play with coaching delivered 30% faster ramp and a 37% average performance increase.
Metrics only pay off inside a program that acts on them. For where these sit in the wider ramp, see our sales onboarding and ramp time guide.
What are sales onboarding metrics?
Sales onboarding metrics are the data points a manager tracks during a new rep's first weeks to gauge whether they are building the skills to sell, not just absorbing information. They split into two groups: activity metrics like module completion and call volume, and behavioral metrics like talk-to-listen ratio, question rate, and objection handling.
The behavioral group is where readiness lives. The real question in onboarding is rarely whether a rep is struggling, it is understanding where and why. A manager can feel that a rep "isn't ready" without being able to name the gap. Metrics replace that hunch with specifics: their discovery talk ratio sits at 72% when it should be under 65%, or they address three objections out of ten in practice.
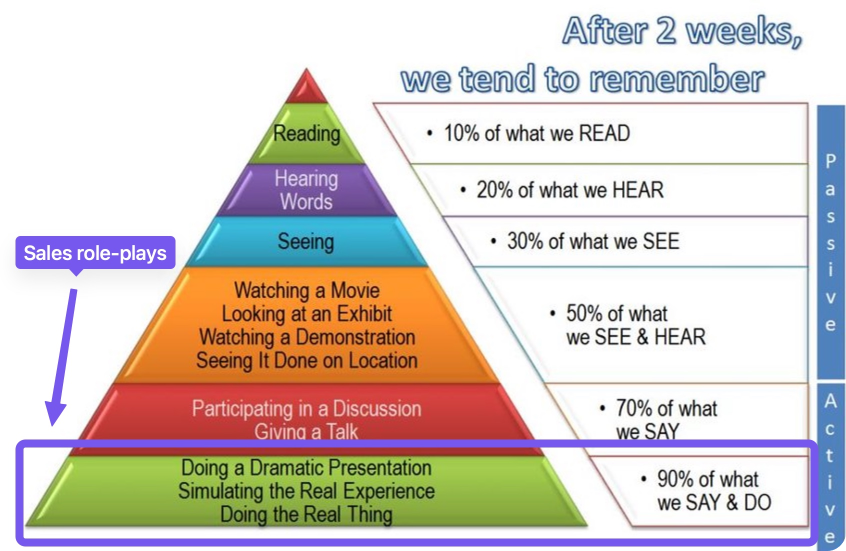
There is a reason completion percentages mislead. A rep retains a fraction of what they hear in a lecture and most of what they practice out loud, which is why a "100% course complete" badge tells you so little about live-call skill. The learning-retention pyramid below is the argument for weighting practice metrics over consumption metrics.
That precision matters because a failed hire is expensive. Replacing a rep who churns in month three can cost several times their salary once you count the recruiting, the lost ramp, and the pipeline that never got built. Catching the gap in week two instead of month three is the difference between a coaching conversation and a re-hire.
Leading vs lagging onboarding metrics
Most onboarding dashboards are built on lagging metrics, the numbers that confirm a rep worked out only after months have passed. Time to first deal, quota attainment, and ramp time to full productivity are all lagging. They are real and belong on your dashboard, but they arrive too late to change the outcome for the rep in front of you. Leading metrics move first: how a rep talks, listens, and handles pressure in practice this week predicts the revenue number you will not see for another quarter.
Metric | Type | What it tells you | When you can act on it |
|---|---|---|---|
Module / course completion | Lagging (activity) | A rep finished the material | Too late to predict live-call skill |
Time to first deal | Lagging | How fast a rep became productive | Weeks 8-16, after the fact |
Ramp time to full productivity | Lagging | Whether the program worked overall | Months in |
Quota attainment rate | Lagging | Long-run performance | 2-4 quarters in |
Talk-to-listen ratio | Leading | Whether a rep runs a two-way conversation | Session one |
Question count per call | Leading | Whether a rep discovers or pitches | Session one |
Objection-handling rate | Leading | Whether a rep holds up under pushback | Week two |
Role-play score vs playbook | Leading | Overall readiness against your bar | Every session |
The lagging metrics still earn their place. Time to first deal is the cleanest measure of how quickly a hire becomes productive. Ramp time to full productivity tells you whether the program works across a whole cohort, not just your fastest learner. Quota attainment is the long-run scoreboard nobody argues with. The catch is timing: by the time a rep misses quota in quarter two, the coaching window that would have fixed it closed months earlier.
Leading indicators hand that window back. A rep whose discovery talk ratio is stuck at 72% in week two will likely miss quota in month five, and the talk ratio told you in week two. To calculate ramp time to full productivity, count the days from a rep's start date to the point they hit a set bar, usually full quota attainment for one period, and track the cohort median rather than the single fastest hire so one star does not hide a slow program.
Benchmark tables by phase
Benchmarks are only useful when they shift as a rep matures. A number that signals progress in week two can signal a stalled rep by month two. The table below maps the metric you should weight most heavily in each onboarding phase, with a target to coach toward.
Onboarding phase | Primary metric focus | Target benchmark |
|---|---|---|
Weeks 1-2 | Script adherence and talk ratio | >70% adherence; <65% talk ratio |
Weeks 3-4 | Objection handling and question count | >50% objections addressed; 8+ questions |
Month 2-3 | Full performance metrics | <50% talk ratio; 11+ questions; >75% objection handling |
Month 4+ | Performance parity | Within 10% of top-performer benchmarks |
Read it as a progression. Early on, you are checking that a rep can follow the core pitch and stop dominating the call. By month two, the bar moves to genuine two-way conversation and reliable objection handling. By month four, a ramped rep should land within striking distance of your team's top performers on the same scorecard.
This maps cleanly onto the 30-60-90 rule many teams already run. By day 30, a rep should know the product and hold the script together. By day 60, they should be clearing coached practice and shadow calls at the weeks 3-4 targets above. By day 90, they should be taking live calls under review at month 2-3 benchmarks. The difference is that a metric target sits behind each checkpoint, so the plan is measured, not just scheduled.
The single readiness view below is the one most managers reach for when deciding who can take real leads. It collapses the phase table into two columns: where a rep should be in the first month, and where they should be by month two and beyond.
Metric | Weeks 1-4 target | Month 2+ target |
|---|---|---|
Talk-to-listen ratio | <65% | <50% |
Question count | 8+ per call | 11+ per call |
Script adherence | >70% | Focus on value and flow |
Objection handling | >50% addressed | >75% addressed |
Consistent movement in the right direction across these four rows is a stronger readiness signal than any single high score. A rep who climbs from 50% to 75% on objection handling over a month has shown they can learn the skill, which is what you are really betting on when you hand them a live lead.
Conversation metrics that decide deals
Delivery tells you how a rep sounds. Conversation metrics tell you whether they are connecting with the person on the other end. These three carry the most signal during onboarding.
Talk-to-listen ratio
Talk ratio is about context, not a single ideal number. On a cold call, a rep should talk 60 to 70% of the time because they have to earn the conversation. On discovery, the balance flips: the rep talks 30 to 40% and lets the prospect do the work. Reps who keep their discovery talk time in the 38 to 46% band tend to convert at far higher rates than reps who dominate the call at 65% or more.
Call stage | Rep talk target | Purpose |
|---|---|---|
Cold call | 60-70% | Establish context and value |
Discovery | 30-40% | Uncover prospect pain points |
Demo | 50-70% | Present the product |
Negotiation | 35-50% | Balance objections and buying signals |
One more conversation signal worth tracking is how often the speaker changes. A high number of turns suggests a real back-and-forth, while long single-speaker stretches usually mean the rep is presenting at the buyer instead of talking with them, which is a common failure mode on early discovery calls.
Objection-handling rate
Objection handling is where deals turn, which is why it carries heavy weight on most call scorecards. During onboarding the goal is a repeatable approach, not a clever one-liner. A clear four-step pattern works: acknowledge the objection, explore what is behind it, respond to that specific concern, then confirm you resolved it. The most common new-hire mistake is skipping the explore step and jumping straight to a rebuttal before they understand the worry.
Score each objection on a simple scale rather than pass or fail. A 1 means the rep ignored or deflected it, a 3 means they acknowledged it but left it half-addressed, and a 5 means they reframed it with a relevant proof point. For new hires, aim for at least 50% of objections handled well by weeks three to four, rising to 75% or more by month two.
Question rate and active listening
The questions a rep asks are one of the clearest windows into whether they are listening or waiting to pitch. Top performers ask roughly three times as many questions per call as average reps, and on discovery they typically ask 11 or more. For new hires running role-play scenarios, a target of eight or more questions per call by weeks three to four is a practical starting bar.
Follow-up questions matter as much as the count. A rep who asks two or three follow-ups after a prospect names a pain point is showing genuine curiosity, not running a checklist. You can also read active listening in the pause before a rep responds: an instant reply often means they were loading their next line instead of processing what they just heard.
Delivery metrics that signal readiness
Clear delivery is the foundation the conversation metrics sit on. A rep who rushes, fills the air with "um," or drones on for a minute straight loses the buyer before the message lands. These are the delivery signals worth tracking, with practical benchmarks.
Metric | What to measure | Target benchmark |
|---|---|---|
Filler word frequency | "Um," "uh," "like" per minute | <2 per minute |
Speaking pace | Words per minute | ~145 WPM |
Monologue length | Longest uninterrupted stretch | <45 seconds |
Uptalk frequency | Rising inflection on statements | Minimal to none |
Tone confidence | Hesitation or flat delivery | Improving session over session |
Pace is the one reps get wrong most often. Around 145 words per minute reads as confident: fast enough to carry energy, slow enough to stay clear. Nerves push that number up, and a rushed rep is a hard rep to follow. Monologue length is the next watch item, because a stretch over 45 seconds without a check-in is usually where a buyer's attention drifts. Filler words and uptalk are harder to self-correct, which is exactly why measuring them session over session helps a rep see progress they cannot feel in the moment.
Set a 'ready for live calls' threshold
The point of tracking these metrics is one decision: can this rep take a real lead? Without a fixed bar, that call comes down to whoever is most confident in the room. With one, it comes down to evidence.
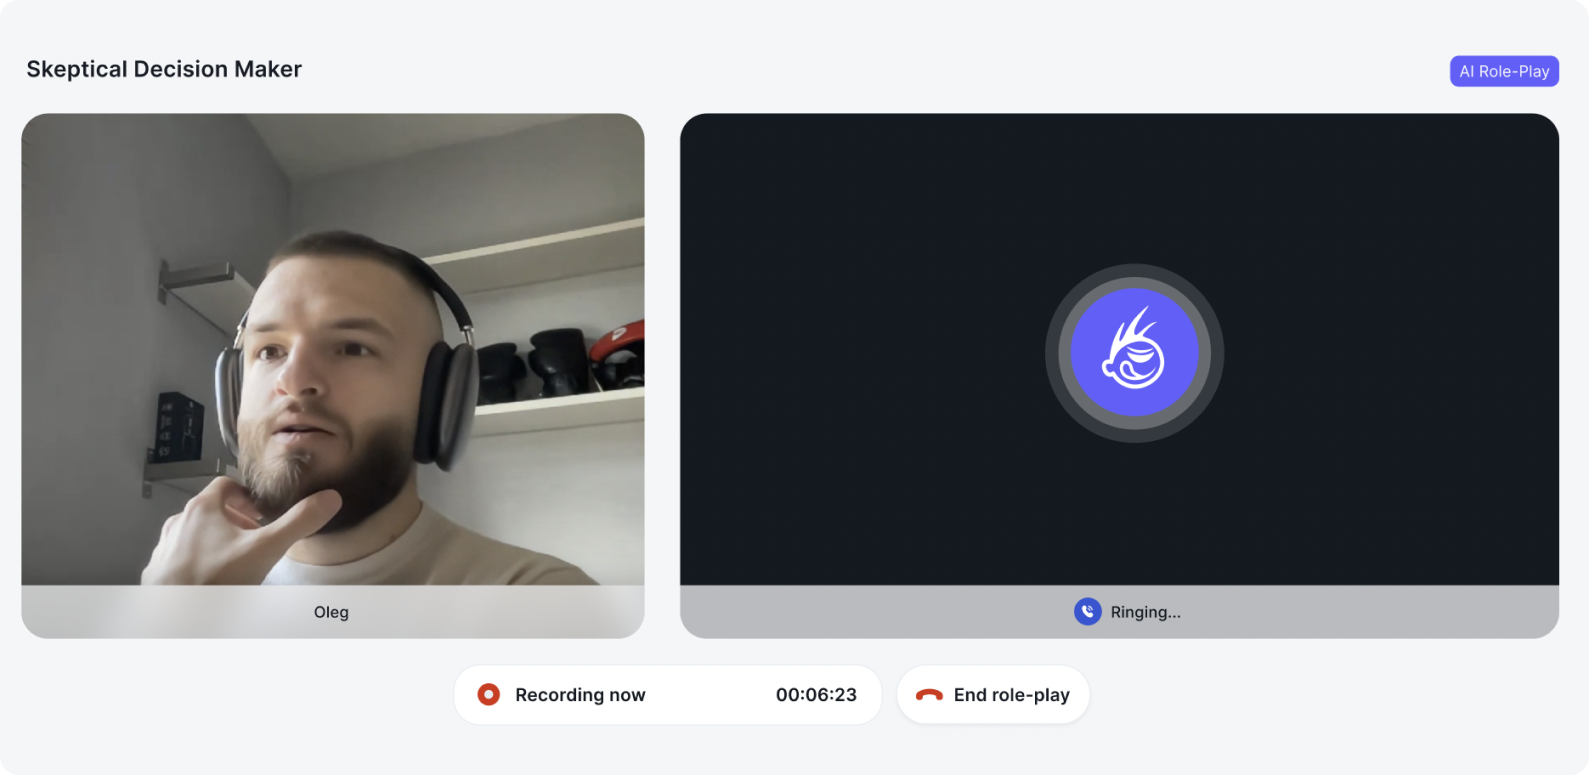
Define the threshold as a combination, not a single number. A workable bar is a role-play score of 65 out of 100 or higher across three consecutive sessions at an intermediate difficulty, together with a discovery talk ratio under 65% and objection handling above 50%. Reps who clear it have shown the skill more than once under pressure, which is a far better predictor than a single good session.
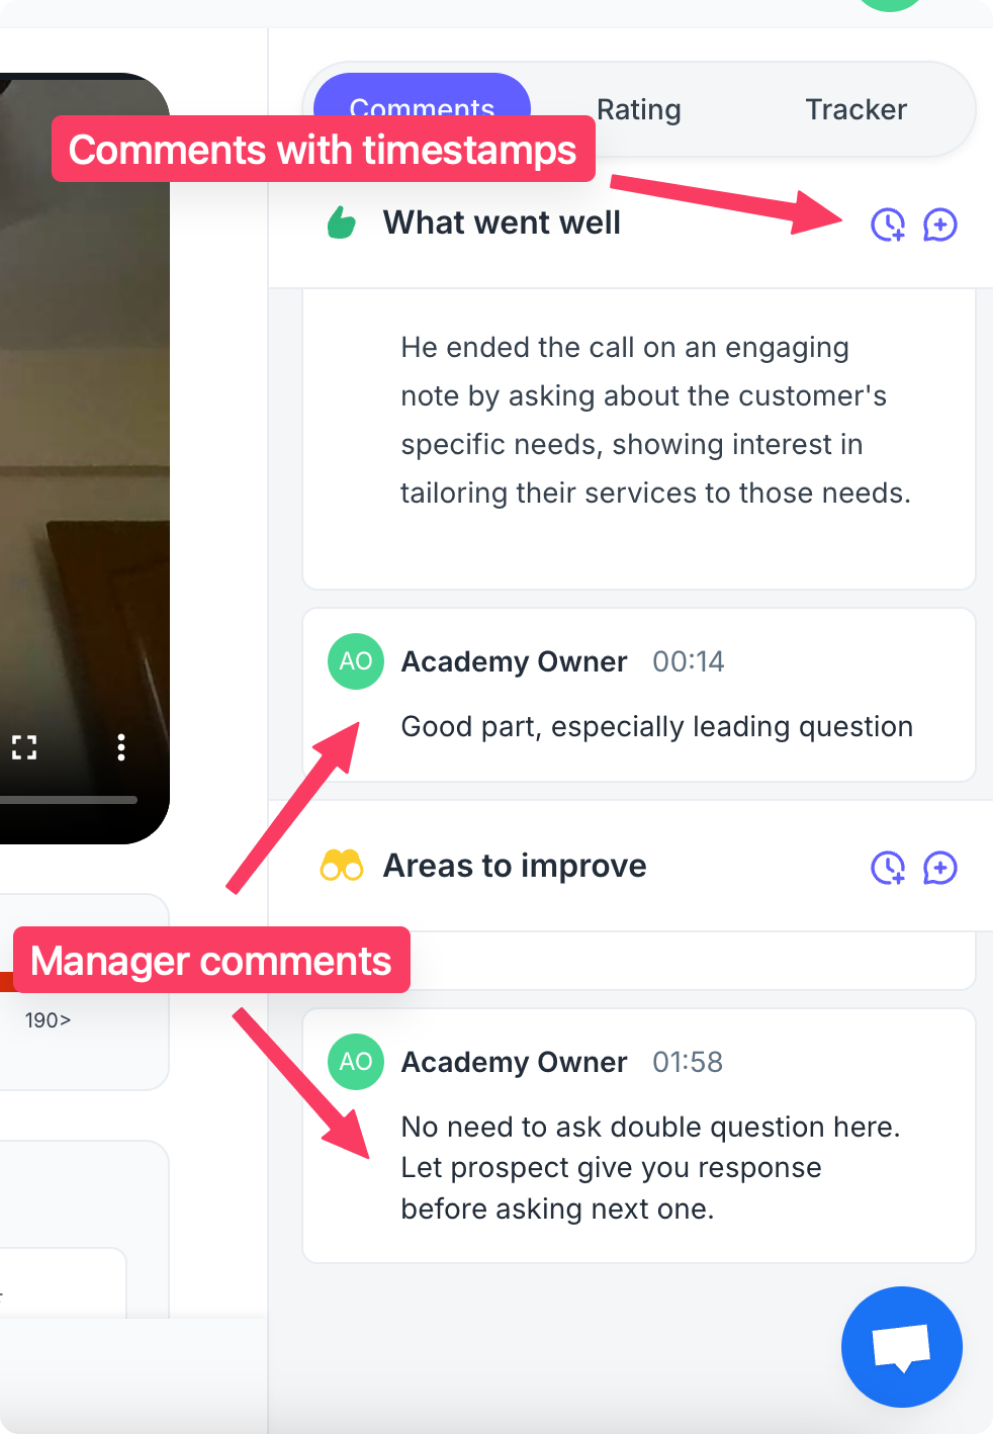
The reason to track trends, not snapshots, is that improvement is the signal. A rep cutting filler words week after week or moving objection handling from 50% toward 75% is demonstrating they can absorb coaching. That trajectory tells you more about how they will perform on live calls than any one score, and it gives you a defensible reason to either certify them or keep them in practice a little longer.
How to track these metrics with AI
Tracking all of this by hand falls apart the moment you onboard more than one or two reps at a time. Listening to every practice call, scoring talk ratio and question count by ear, and keeping it consistent across a cohort is more than most managers can do on top of their own number. That is why most teams cap practice at a few coached sessions a quarter, which is far too little to move the benchmarks above.
What sets PitchMonster apart from a scoring tool is the AI Coach. After each session, before a rep ever sees a score, the AI Coach asks them what they noticed and what they would do differently, so the insight is theirs first. That self-diagnosis is where behavior actually changes, and no competitor offers it. Reps arrive at the scorecard already knowing what they want to fix, which is why the numbers move faster than a manager reading feedback at them ever could.
Underneath the coach sits the instrumentation. Reps practice realistic scenarios on demand, an AI buyer pushes back like a real prospect, and every session is scored against the same playbook, so talk-to-listen ratio, questions asked, filler words, pacing, and objection-handling steps all land in one dashboard automatically. Live Call Analysis scores real recorded calls against the same scorecard, so the number a rep hits in practice is the number you check on their first live calls. A manager sees who is ready without reviewing a single recording end to end. Managers can build a scenario from a call recording, a website URL, or product docs in about two minutes, and reps can run it in 27 languages, which is what makes the practice volume behind faster ramp realistic.
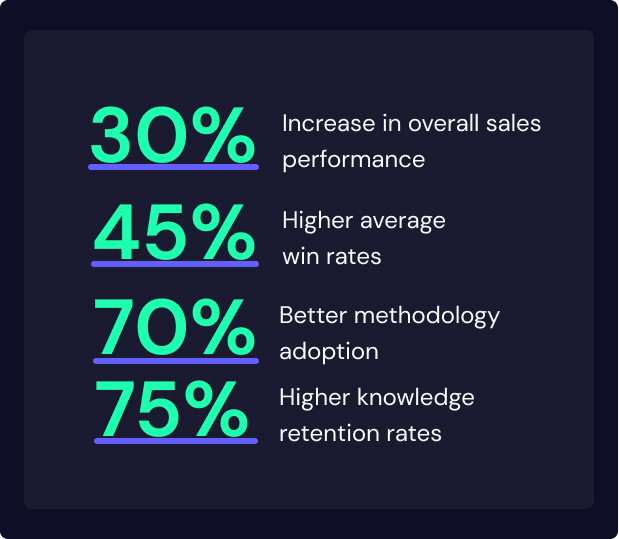
The payoff shows up in the numbers. In the Mentor Group case study, onboarding reps for Lenovo and Syngenta with scalable AI role-play delivered 30% faster ramp, a 37% average performance increase, a 28% win-rate improvement, and 2x more opportunities booked. That track record holds up over time: PitchMonster has kept a 100% enterprise renewal rate since spring 2024, has trained more than 300,000 reps, and carries a 4.9 out of 5 rating on G2. For the step-by-step build behind these benchmarks, see how to reduce sales onboarding time by 50%, and to put a scorecard behind your own ramp, book a demo or see pricing.
FAQ
What are the most important sales onboarding metrics?
The metrics that predict ramp are leading indicators of behavior, not just revenue. Track talk-to-listen ratio, questions asked per call, objection-handling rate, speaking pace, and a role-play score against your playbook. Pair them with ramp time to first deal and certification scores so you see whether a rep is ready before lagging revenue confirms it.
What is the difference between leading and lagging sales onboarding metrics?
Lagging metrics confirm the result after the fact: time to first deal, ramp time to full productivity, and quota attainment. Leading metrics move first and predict that result: talk-to-listen ratio, question count, objection-handling rate, and role-play scores you can read in a rep's first week. Lagging metrics tell you what happened; leading metrics give you time to change it.
What are the three most important onboarding metrics to start with?
If you can only track three, use talk-to-listen ratio, objection-handling rate, and a role-play score against your playbook. Those three cover whether a rep runs a two-way conversation, holds up under pushback, and clears your overall bar. Add time to first deal later as the lagging metric that confirms the leading three were right.
What is a good talk-to-listen ratio for a sales rep?
It depends on the call stage. On discovery calls, a rep should talk roughly 30 to 40% of the time and let the buyer fill the rest. On cold calls, 60 to 70% is normal because the rep has to establish context. During onboarding, aim for a discovery talk ratio under 65% in the first weeks and under 50% by month two.
How many questions should a sales rep ask on a discovery call?
Strong discovery reps ask 11 or more questions on a call, and they ask follow-up questions after a prospect names a pain point. For new hires, set a target of eight or more questions per call by weeks three to four, then raise it to 11 or more by month two. Question count is one of the clearest signals of whether a rep is listening or pitching.
What is the 30-60-90 rule for sales onboarding?
The 30-60-90 rule breaks a rep's first quarter into three checkpoints: by day 30 they know the product and script, by day 60 they run coached practice and shadow calls, and by day 90 they take live calls under review. Attach a metric target to each checkpoint so the plan is measured, not just scheduled.
How do I set a 'ready for live calls' threshold during onboarding?
Pick a measurable bar a rep must clear before touching real leads. A common one is a role-play score of 65 out of 100 or higher across three consecutive sessions at an intermediate difficulty, plus a discovery talk ratio under 65% and objection handling above 50%. A fixed bar replaces a manager's gut feel with evidence everyone can see.
How can AI score sales onboarding metrics without a manager reviewing every call?
AI transcribes each role-play or recorded call and scores it against a custom rubric, measuring talk-to-listen ratio, questions asked, filler words, pacing, and objection-handling steps. It returns the result in seconds and rolls every rep into one dashboard, so a manager sees who is ready without sitting through hours of recordings.